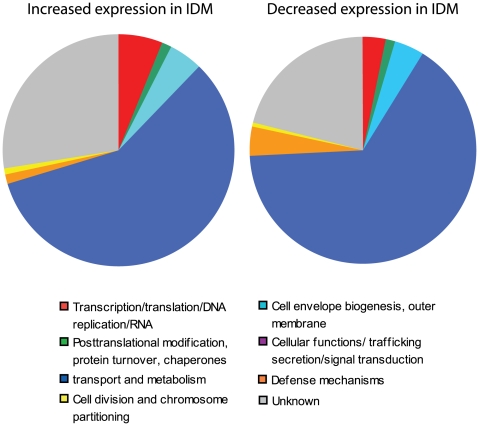
Figure 4. Categorical analysis of genes induced during iron starvation.
Pie charts represent the COG classification for the genes uniquely regulated in the conditions listed. Each pie represents 100% of the genes exhibiting significant gene expression changes following growth in iron depleted media. COG categories were identified for each differentially regulated gene based on genomic annotation (GenBank accession, NC_007530). To simplify the analysis, the COG categories were grouped into general categories as follows: Categories A, J, K, L, and RNA genes were merged into “Transcription/translation/DNA replication/RNA”; C, E, F, G, H, I, P, and Q were combined into “Transport and metabolism”; COGs N, T, and U were combined into “Cellular functions/trafficking/secretion/signal transduction”; and categories R and S were grouped with uncategorized genes and classified as “Unknown.” Other COG categories listed are reported as they were originally defined.

