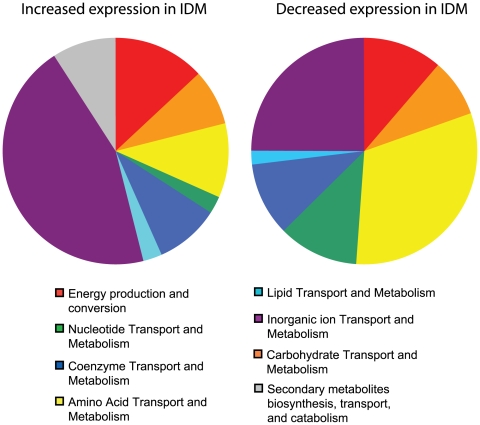
Figure 5. Specific analysis of metabolic changes induced in B. anthracis during iron starvation.
Each pie represents 100% of the metabolism related genes exhibiting significant gene expression changes following growth in iron depleted media (blue slice from Figure 4). Specific COG categories were identified for each gene based on genomic annotation (accession, NC_007530) and are listed as they were originally defined.

