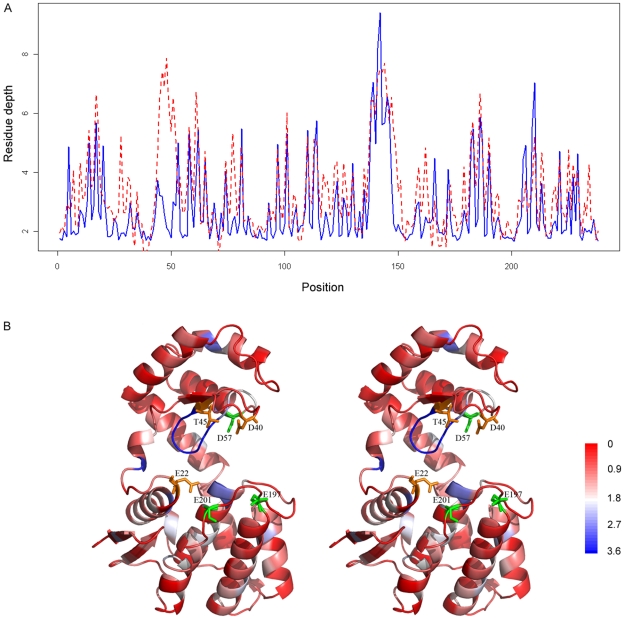
Figure 8. The predicted and observed residue depth profiles for the anti-fungal chitosanase (PDB code:1chk, chain A), as well as the structural mapping of the predicted RD profiles.
In Figure 8A, the blue solid line represents the observed RD values, while the red dashed line represents the predicted RD values. In Figure 8B, the sequence regions predicted with different mean absolute errors are colored with a color scale going from red to blue, where red corresponds to the best predicted regions and blue to worst predicted regions. In addition, the active site residues (E22, D40 and T45) are highlighted by the orange sticks, while the functionally important residues involved in chitosan substrate binding (D57, E197 and E201) are represented by dark green sticks [52], [53]. The structural images are prepared using the program PyMOL [82]. For the sake of visualization, structural figures are shown in stereo.

