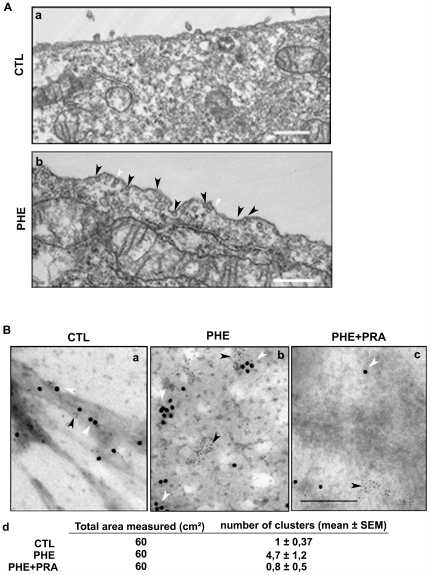
Figure 3. Cell surface modification and caveolin-1 mobilization following α1A-AR stimulation.
(A) Representative electron micrograph of DU145 cells in (a) non-treated condition (b) after 10 min treatment by 10 µM PHE. Caveolae and caveolin containing vesicles of 50–80 nm diameter are dense in electrons are indicated by black arrowheads. White arrowheads indicate complex shaped caveolae. Bar, 500 nm. (B) Representative electron micrograph of plasma membrane “ripped-off” from (a) non-treated cells, (b) treated for 10 min with 10 µM PHE alone and (c) PHE in the presence of 1 µM PRA. 6 nm gold particles represent anti-α1A-AR labelling (black arrowheads) and 12 nm particles represent anti-cav-1 (white arrowheads). Bar, 200 nm. (d) The area of randomly selected negatives of electron micrographs (ten/condition) was measured at a magnification of 20000. The number of cav-1 and α1A-adrenoceptor-containing clusters (minimum 3 gold particles for each protein) was counted (mean ± SEM).

