
Fig. 2.
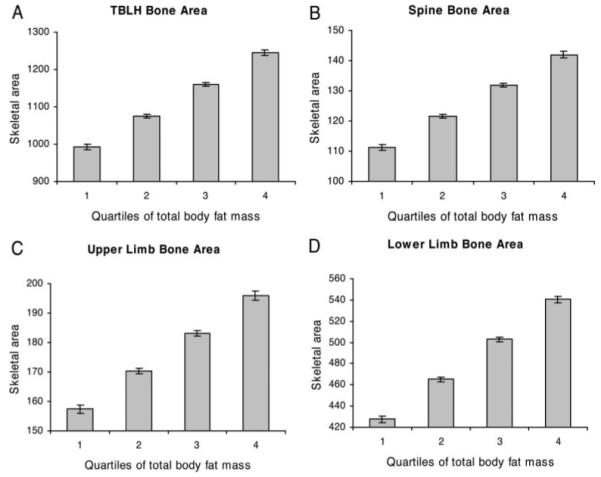
Effect of total-body fat mass on skeletal area adjusted for age at DXA scan, gender, ethnic group, and socioeconomic status. Results show mean ± 95% confidence interval of skeletal area for TBLH (A), spine (B), upper limbs, (C) and lower limbs (D), according to quartile of total-body fat mass in 3082 boys and girls undergoing DXA scans at age 9.9 yr. Test for trend showed statistically significant (P < 0.001) association between fat mass quartile and skeletal area at all four sites.