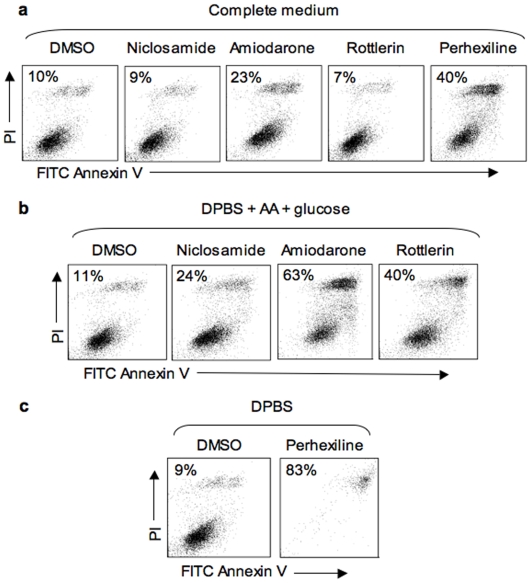
Figure 10. Effect of active chemicals on membrane integrity and apoptosis.
TSC2+/+ MEFs were incubated for 4 h with DMSO or with 3 µM niclosamide, 30 µM amiodarone, 3 µM rottlerin or 10 µM perhexiline in the cell culture media indicated. Chemicals and media were washed away and the cells were incubated for 24 h in complete medium without chemicals. The extent of cell death and apoptosis was determined by measuring propidium iodide uptake (PI, y axis; relative fluorescence intensity measured in FL2 channel) and FITC Annexin V staining (x axis; relative fluorescence intensity measured in FL1 channel) by flow cytometry. Live cells (PI- and Annexin V-negative) appear in the lower left part of the scatter plots while cells that have died of apoptosis (PI- and Annexin V-positive) appear in the upper right hand part. The numbers in each box indicate the percent of dead or dying (PI- and/or Annexin V-positive) cells.

