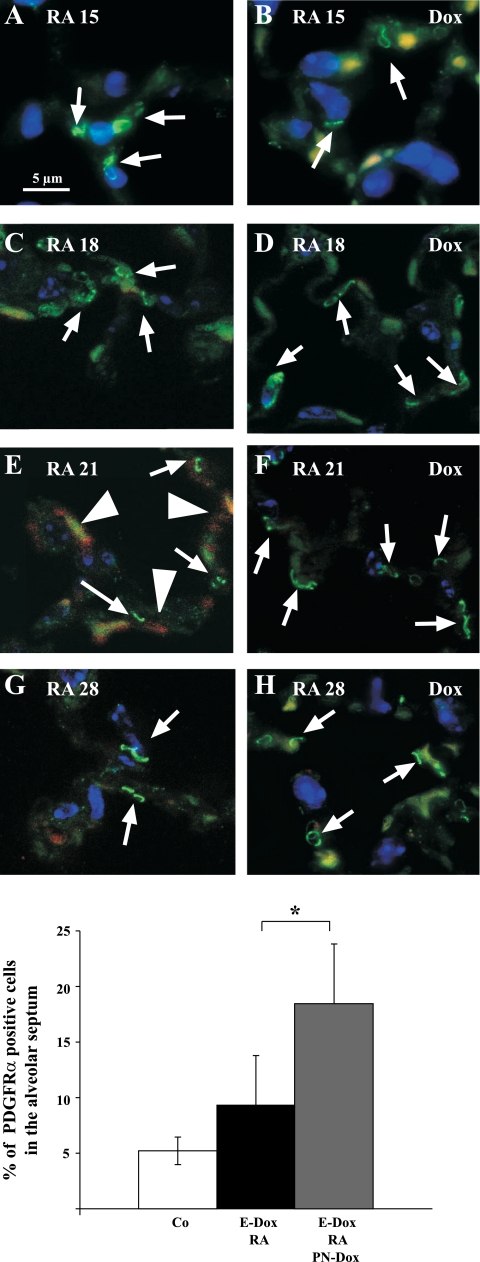
Fig. 6.
αSMA expression but not PDGF receptor-α (PDGFRα) expression is suppressed by dnFGFR. Immunohistochemistry is shown for αSMA (red, cytoplasmic), PDGFRα (green, punctuated signal on the cell membrane), and DAPI (blue, nuclear) on DbTg mice after prenatal inhibition of FGF signaling and 3, 7, and 14 days after RA treatment. Expression of PDGFRα (arrows) on the cell membrane of some alveolar fibroblasts can be found at all time points after RA treatment is finished (A, C, E, and G). In the presence of FGF signaling, αSMA (arrowheads) expression was induced 7 days after RA treatment (E). dnFGFR was expressed during RA treatment and alveolar repair (B, D, F, and H). Expression of dnFGFR suppressed αSMA after RA treatment (F and H). More cells expressed PDGFRα (arrows) 1 wk after completion of RA treatment (compare D, F, and H with C, E, and G). Scale bar = 5 μm. Autofluorescence of red blood cells is found in the red and green channels and results in a yellow signal. I: morphometric analysis of PDGFRα expression in RA21 lungs revealed a significant increase in PDGFRα-expressing cells when dnFGFR was expressed. White column: control: 5.21% (±1.23%) of the cells express PDGFRα (n = 4). Black column: DbTg, E-Dox: 9.43% (±4.35%) of the cells express PDGFRα (P < 0.068; n = 7). Gray column: DbTg, E-Dox, PN-Dox: dnFGFR expression increases percentage of PDGFRα cells 18.32% (±5.52%). *P < 0.0044; n = 3.

