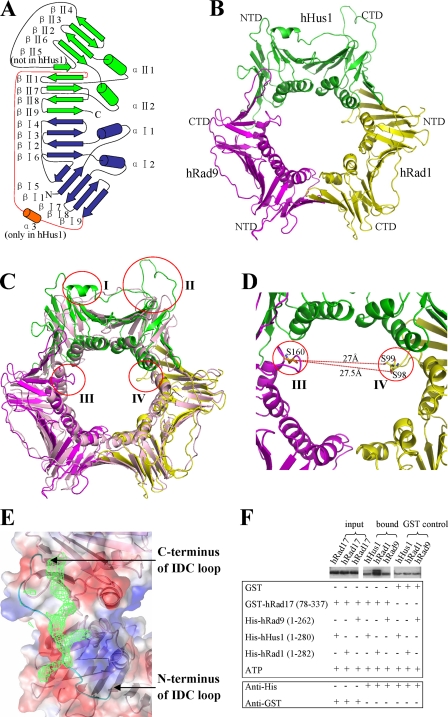
FIGURE 1.
Structure and binding assay of the 9-1-1 complex. A, schematic diagram of the secondary structural elements in one molecule of the 9-1-1 complex. The N-terminal domain is colored blue, whereas the C-terminal domain is colored green. The IDC loop is colored red. The α3 helix inserted in the N terminus of the IDC loop in hHus1 is colored orange. B, three-dimensional diagram of the 9-1-1 complex. NTD and CTD indicate the N- and C-terminal domains, respectively. C, superposition of the 9-1-1 complex and PCNA. hRad9 is shown in magenta, hHus1 is in green, hRad1 is in yellow, and PCNA is in light pink. The four most notable differences are indicated by red circles. I indicates the α3 helix inserted in the N terminus of the IDC loop of hHus1; II indicates the βII4–βII6 loop connecting βII4 and βII6 in hHus1; and III and IV respectively indicate the αII1–βII2 loop of hRad9 and the αI2–βI7 loop of hRad1 near the channel in the 9-1-1 complex. D, the closest distance between the αII1–βII2 loop in hRad9 and the αI2–βI7 loop in hRad1. E, the electron density for the hFen1 peptide on the binding site of hRad1 in the 9-1-1 complex. The electron density is contoured at 0.7σ in the 2|Fo| − |Fc| map. F, GST pulldown assays to analyze the interactions of the truncated hRad17 with hHus1, hRad1, and hRad9. GST proteins are used as control. The lower bands in the samples labeled bound and GST control indicate nonspecific GST-interacting protein. The interaction of the truncated hRad17 with hRad1 is markedly stronger than its interaction with the other two proteins.

