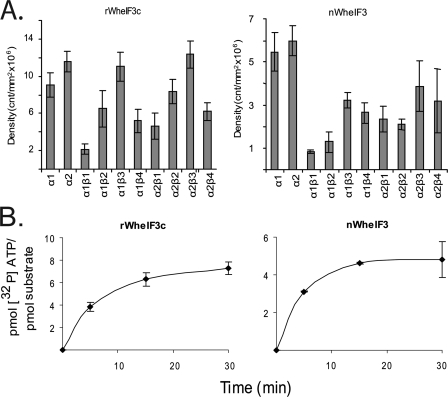
FIGURE 7.
Phosphorylation and quantitative phosphorylation of wheat eIF3c. A, recombinant WheIF3c (15 pmol) or native WheIF3 (5 pmol) was incubated with CK2α or CK2 holoenzyme as described under “Experimental Procedures.” Each reaction was separated by SDS-PAGE on a 12.5% gel. The gel was dried and analyzed by phosphorimaging to quantify incorporation of 32P into the substrate. Units are arbitrary and are expressed as counts/mm2. Each reaction was performed in triplicate and averaged. Error bars represent standard deviation. B, rWheIF3c (150 pmol) or nWheIF3 (50 pmol) was incubated with CK2α1 as described under “Experimental Procedures.” Reactions were stopped by the addition of ∼1 ml of cold HMK buffer. Samples were immediately captured on a nitrocellulose filter and quantitated using a scintillation counter. Each reaction was performed in triplicate, and the results were averaged. Error bars represent standard deviation.

