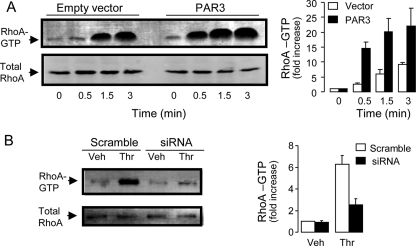
FIGURE 5.
PAR3 promotes RhoA activation. A, total RhoA and RhoA-GTP were measured in A549 cells transfected with 100 ng of empty vector or PAR3 cDNA, as in Fig. 2. RhoA activation was visualized by the pulldown assay (left), as described under “Experimental Procedures.” RhoA activation is expressed as -fold increase over control (vector, t = 0); values are the mean ± S.E. of ten independent experiments (right). B, PAR3 siRNA reduced thrombin (30 nm, 5 min)-promoted RhoA activation. The Western blot (left) is representative of four experiments performed under similar conditions. Values (right) are expressed as -fold increase over vehicle in scramble-transfected cells (mean ± difference to mean, n = 4).

