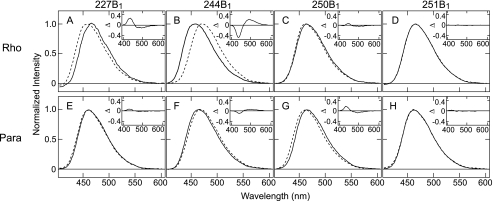
FIGURE 2.
Fluorescence emission spectra of the mBBr labeled mutants of bovine rhodopsin and parapinopsin. Emission spectra of mBBr labeled mutants 227C (A), 244C (B), 250C (C), and 251C (D) of bovine rhodopsin and parapinopsin mutants 227C (E), 244C (F), 250C (G), and 251C (H) are shown. Spectra are normalized by maximal fluorescence intensity as 1.0. Solid and broken lines indicate spectra before and after photoactivation, respectively. Experimental conditions are described under “Experimental Procedures.” λmax values for the labeled bovine rhodopsin mutants are 466 nm (227B1 in the dark), 459 nm (227B1 after photoactivation), 457 nm (244B1 in the dark), 471 nm (244B1 after photoactivation), 464 nm (250B1 in the dark), 462 nm (250B1 after photoactivation, 464 nm (251B1 in the dark), and 464 nm (251B1 after photoactivation). The emission λmax values for the labeled parapinopsin mutants are 462 nm (227B1 in the dark), 461 nm (227B1 after photoactivation), 464 nm (244B1 in the dark), 468 nm (244B1 after photoactivation), 466 nm (250B1 in the dark), 462 nm (250B1 after photoactivation, 463 nm (251B1 in the dark), and 463 nm (251B1 after photoactivation). The insets show the difference in the emission spectra of before versus after photoactivation. The spectral changes in 244B1 mutants upon photoactivation of bovine rhodopsin and parapinopsin were not changed between pH 6 and 8 (see supplemental Fig. S5), suggesting that differences of conformational changes between the two rhodopsins are not because of differences in pH effects.

