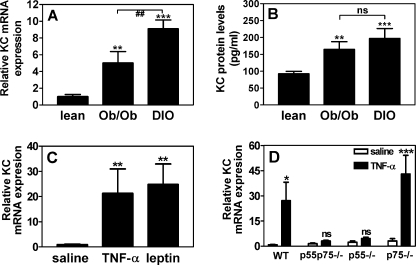
FIGURE 1.
Changes in KC expression in genetically and diet-induced obese mice. KC mRNA levels in epididymal white adipose tissue (A) and KC protein levels in serum (B) from lean, ob/ob, and DIO mice. **, p < 0.005; ***, p < 0.001 versus lean; ##, p < 0.005; ns, not significant. n = 6, mean ± S.D. C, relative KC mRNA expression in adipose tissue from wild-type C57BL/6 mice 3 h after intraperitoneal injection with saline (control), TNF-α (4 μg), or leptin (10 μg). **, p < 0.005 versus saline, n = 6. Mean ± S.D. D, relative KC mRNA expression in adipose tissue from wild-type, p55−/−, p75−/−, and p55p75−/− mice 3 h after intraperitoneal injection with saline (control) or TNF-α (4 μg). *, p < 0.05; ***, p < 0.001; ns, not significant versus saline, n = 4, mean ± S.D.

