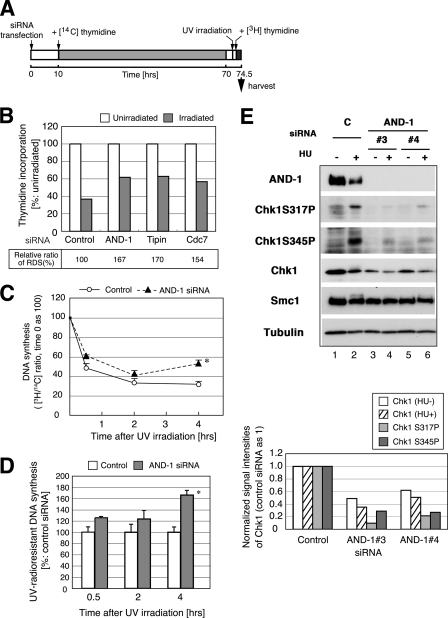
FIGURE 4.
UV radio-resistant DNA synthesis (UV-RDS) in AND-1 knockdown U2OS cells. A, time schedule of the experiment. At 10 h after transfection with control or AND-1 number 3 siRNA, HeLa cells were transferred to the medium containing 20 nCi of [14C]thymidine per ml, followed by incubation for 60 h. After incubation with nonisotopic medium for 2 h, cells were irradiated with UVC (5 J/m2, UV) or mock-irradiated. After 1 h, 10 μCi of [3H]thymidine was added per ml of medium, and incubation was continued for 1.5 h. Cells were harvested, and incorporated radioactivity was measured by scintillation counter. B, ratio of 3H/14C incorporation of AND-1, Tipin, and Cdc7-depleted cells. The values of the unirradiated sample were taken as 100 in each siRNA-treated cells. At the bottom, RDS is shown as values relative to control siRNA, set as 100. We repeated the experiments three times using U2OS or HeLa cells, and the representative data are shown here. C and D, RDS was assessed in time course using the similar protocol described in A except for intensity of UV irradiation (3 J/m2) and for incorporation time of [3H]thymidine (30 min before indicated time). Ratio of 3H/14C incorporation at each time point was plotted. The efficiency of DNA synthesis of unirradiated cells (in C) or that of control siRNA-treated cells after irradiation (in D) was set as 100. Data with asterisks showed significant differences compared with control cells (p < 0.05). Open circles, control siRNA; filled triangles, AND-1 number 4 siRNA. E, knockdown of AND-1 leads to reduction of Chk1 protein level. HeLa cells were transfected with control (C) or AND-1 number 3 or number 4 siRNA and incubated with 2 mm HU for 1 h (+) or untreated (−) before harvest at 48 h after transfection. Twenty μg of protein was resolved on SDS-PAGE, and proteins were detected by the antibodies indicated. The anti-AND-1C antibody was used. In the bottom panel, the signal intensities of Chk1 (untreated, open column; HU-treated, shaded), Chk1 S317P (HU-treated, gray), and Chk1 S345P (HU-treated, dark gray) were normalized with those of α-tubulin. We repeated the experiments five times, and representative data are shown.

