FIGURE 1.
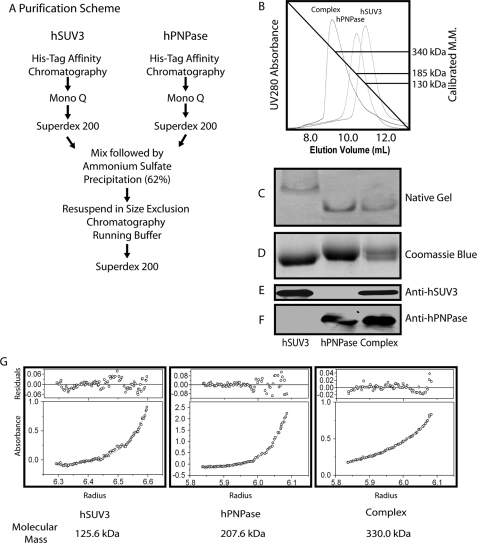
hSUV3 and hPNPase form a 330kDa heteropentameric complex at a 2:3 molar ratio. A, purification scheme of the hSUV3-hPNPase complex. B, size exclusion chromatography (Superdex 200) elution profiles for hSUV3, hPNPase, and the hSUV3-hPNPase complex. The numbers to the right are the approximate molecular masses of the purified proteins based on their peak elution volumes. C, native PAGE (6%, pH 10.0) migration pattern of the purified proteins. D, Coomassie Blue staining of the purified proteins in 8% SDS-PAGE. E and F, Western blotting of the purified proteins in 8% SDS-PAGE. G, UV absorbance curves and the calculated molecular masses of the purified proteins determined by equilibrium sedimentation analytical ultracentrifugation.

