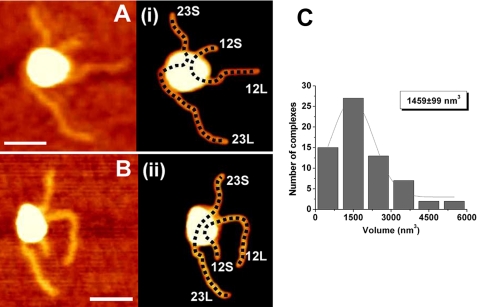
FIGURE 4.
AFM images of RAG synaptic complexes. Representative AFM images are shown in panels A and B along with corresponding rendered images of the complexes (plates i and ii) included for clarity to illustrate the arm designations. The bar length is 40 nm. The DNA path is shown with a dotted line on the rendered image. The lengths measured for 12RSS and 23RSS in this configuration for panel i are 137 and 187 nm, respectively. The expected lengths of 12RSS and 23RSS substrates are 139 and 187 nm, respectively. A histogram of protein volumes calculated for the synaptic complexes is shown in C. The protein volume corresponding to the maximum of the Gaussian fit is shown in the inset.

