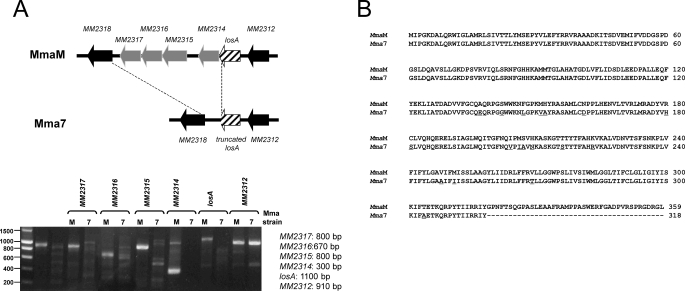
FIGURE 3.
Genomic analysis of the losA region in MmaM and Mma7. A, illustration of the LOS biosynthetic cluster surrounding losA in MmaM and Mma7 (upper panel). Agarose gel showing the different amplicons (MM2312 to MM2317) obtained using either MmaM or Mma7 genomic DNA. Expected sizes of the PCR products in MmaM are indicated on the right (lower panel). B, comparison of LosA amino acid sequences in MmaM and Mma7. Point mutations found in Mma7 are underscored.

