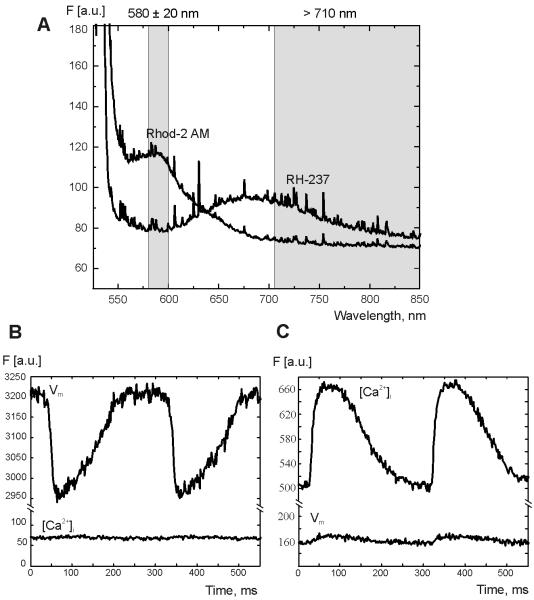
Figure 1. Rhod-2AM and RH-237 fluorescence measured in the heart.
(A) Emission spectra of Rhod-2AM and RH-237. The two vertical gray bands illustrate the light transmission for the band pass (580 ± 20 nm) and long pass (> 710 nm) filters. (B and C) Changes in fluorescence recorded at one pixel when the heart was only stained with either RH-237 (B) or Rhod-2 AM (C) alone.

