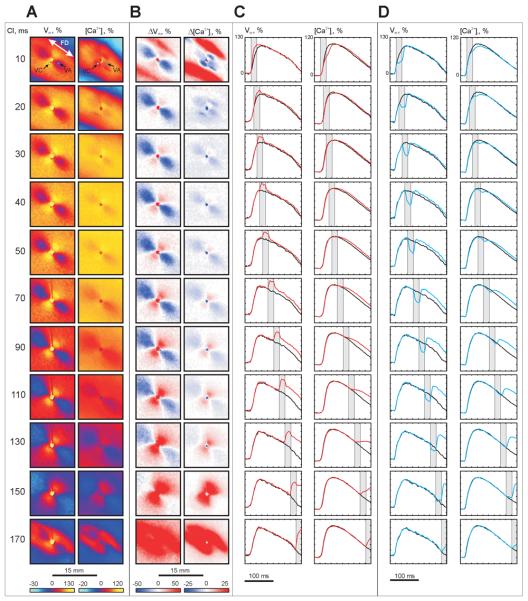
Figure 2. Vm and [Ca2+]i changes induced by S2 (−20 mA, 20 ms) as a function of S1-S2 interval.
(A) Vm and [Ca2+]i distributions at the end of S2. (B) ΔVm and Δ [Ca2+]i distributions at the end of S2. (C) Action potentials (APs) and calcium transients (CTs) within the virtual cathode (white dot in A) resulting from S1-S2 stimulation (red trace) are superimposed on the signals obtained from the same pixel when S1 alone was used (black trace). (D) APs and CTs (blue) within the virtual anode (blue dot in A) are superimposed on the traces resulting from S1 (black). The vertical gray bands indicate S2 timing. The numbers on the far left are S1-S2 intervals in ms. The image size in A and B is 15 × 15 mm2.

