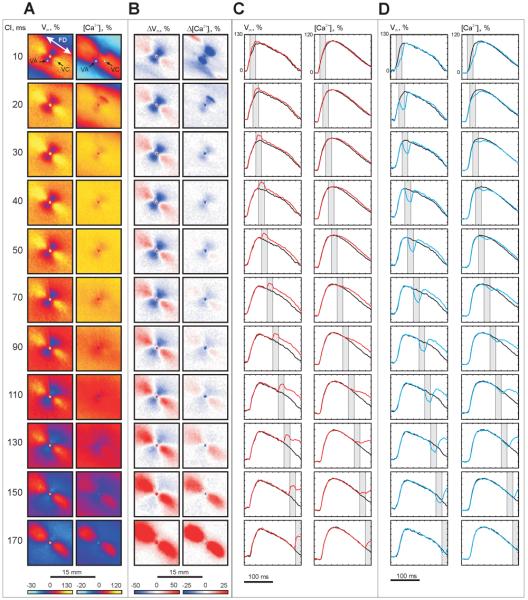
Figure 3. Vm and [Ca2+]i changes induced by S2 (+20 mA, 20 ms) as a function of S1-S2 interval.
(A) Vm and [Ca2+]i distributions at the end of S2. (B) ΔVm and Δ[Ca2+]i distributions at the end of S2. (C) S1-S2 VC traces (red) are superimposed on the signals induced with S1 alone (black). (D) S1-S2 VA traces (blue) are superimposed on the signals induced with S1 alone (black). The pixel locations of the traces are indicated by white and blue dots in A.

