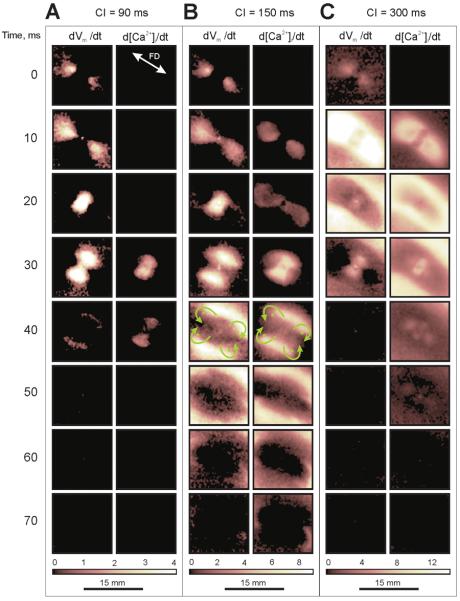
Figure 7. Vm and [Ca2+]i outcomes from anodal stimulation.
The S1-S2 intervals for (A) non-propagating response, (B) break stimulation and (C) make stimulation are the same as in Figure 6. Green arrows in panel B indicate the direction of wave front propagation around the green dots.

