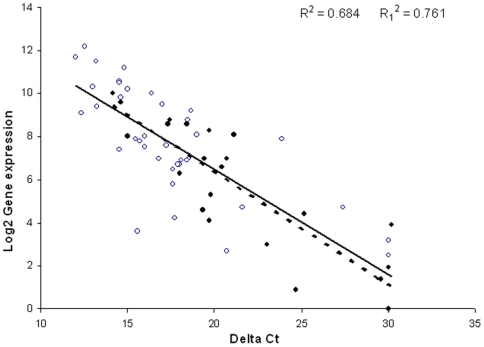
Figure 3. Correlation between gene expression levels calculated using mgMOS and those measured by Taqman RT-PCR.
The correlation coefficient for the 61 genes represented here was significant (R2 = 0.684, p<0.0001), as was that for the 24 genes in the final cluster to gata3 (R2 = 0.761, p<0.001). The relationship holds over a wide range of log2 values of gene expression from 0–12. The slope is the same for all genes (solid line for all points) and for those in the final cluster to gata3 (dotted line for filled symbols only). The data show that mgMOS provides an accurate measure of gene expression for genes expressed at both high and low levels.

