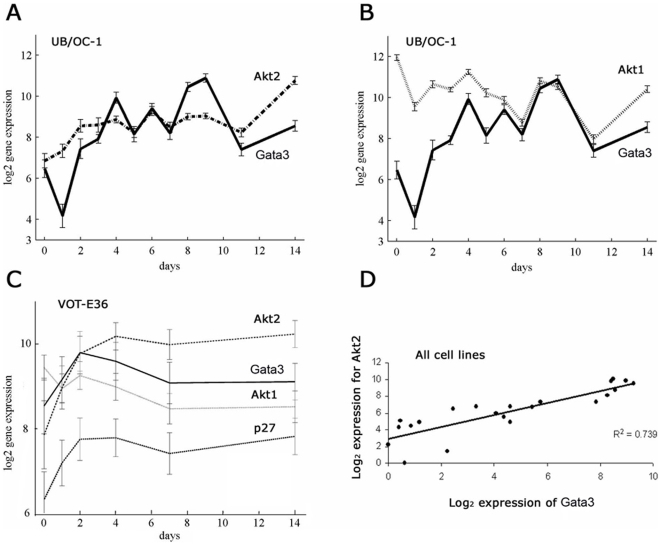
Figure 4. Expression profiles for gata3 and PKB/Akt over a period of 14 days in vitro.
OC-1 was cultured with serum and in the data represented here VOT-E36 was cultured in defined media. Cells were transferred to differentiating conditions at 39°C on day 0. All expression levels were plotted as log2 values in which each unit increase was equivalent to a 2-fold change. A – Expression of gata3 and PKBβ/Akt2 plotted against days of differentiation in OC-1 with serum. The shapes of the temporal profiles for the 2 genes were closely related after day 2. B - Expression of gata3 and PKBα/Akt1 plotted against days of differentiation in OC-1 with serum. C – Expression levels for gata3, PKBβ/Akt2, PKBα/Akt1 and p27kip1 plotted against time for VOT-E36 in defined culture medium. D – Expression of gata3 plotted against PKBβ/Akt2 for all hybridizations, including data for VOT-N33 and VOT-E36 with serum. Each point represents a separate array, including 12 from OC-1, 6 from VOT-E36 in defined media, 2 from VOT-E36 in serum and 2 from VOT-N33 in serum. The correlation coefficient R2 was 0.739 (p<0.001).

