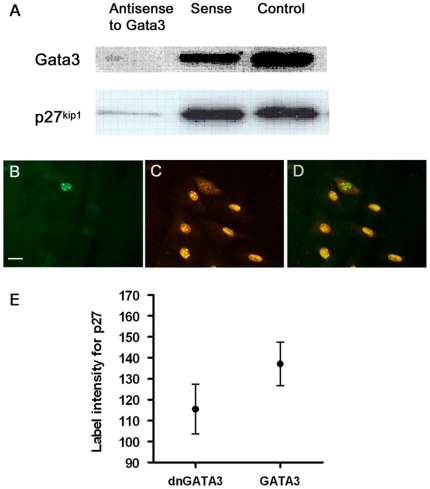
Figure 8. Regulation of p27kip1 by gata3 in the cell line VOT-N33.
A – Antisense oligonucleotides used to knock down expression of gata3 led to simultaneous loss of p27kip1 protein. B–D – These images are from the same group of cells. dnGata3 (green label in B) led to cytoplasmic localisation of p27kip1 (labelled in red) and loss from the nucleus (C,D). E – In cells transfected with dngata3 the levels of p27kip1 protein were significantly lower (p<0.0001). This result correlated with a decrease in expression of p27kip1 (cdkn1b) following treatment with siRNA to gata3 (Table 4).

