Figure 7.

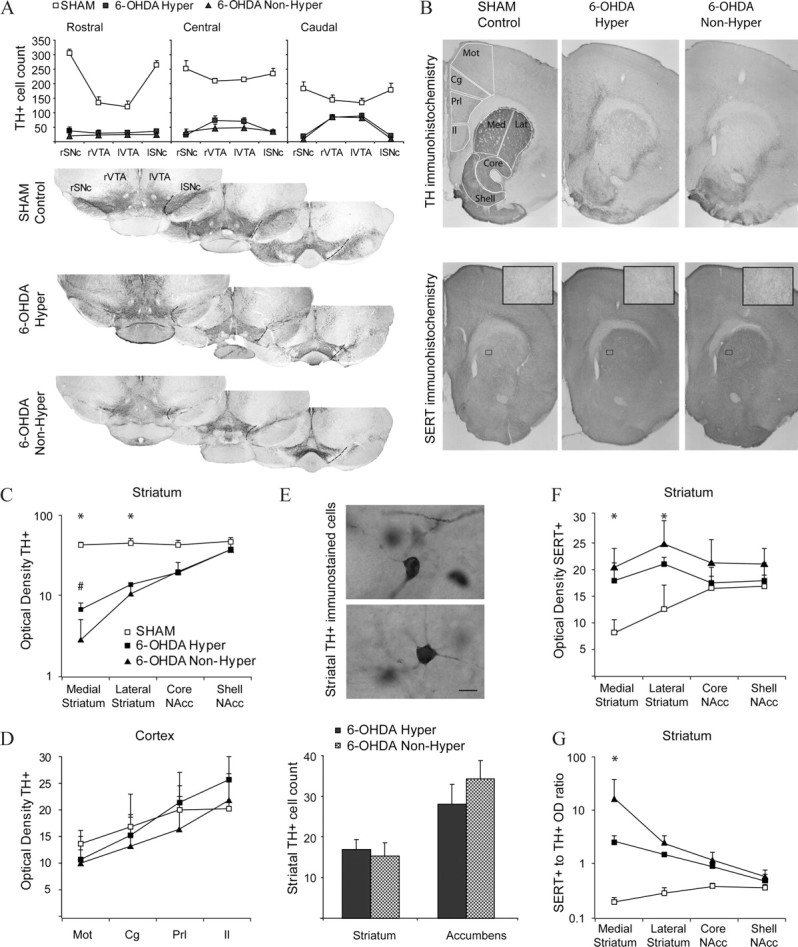
Lesion extent and compensations in hyperlocomotor and nonhyperlocomotor mice. A, TH-immunoreactive neurons remaining in the right (r) and left (l) substantia nigra (SNc) and ventral tegmental area (VTA) in sham (empty squares), hyperlocomotor (filled squares), and nonhyperlocomotor (triangles) mice. Cell counts were performed in three coronal sections per animal, as illustrated for representative animals of each group (rostral: bregma −3.00; central: bregma −3.28; caudal: bregma −3.52 mm). B, Photographs spanning the striatum and medial prefrontal cortex in a representative sham (left), hyperlocomotor (middle), and nonhyperlocomotor (right) mice, immunostained for TH (upper line) or SERT (bottom line; insets: high-magnification detail of SERT+ fibers in the striatum). Outlines illustrate the areas used for optical density measurements (Mot, motor cortex; Cg, cingulate cortex; Prl, prelimbic cortex; Il, infralimbic cortex; Med, medial striatum; Lat, lateral striatum; Core, nucleus accumbens core; Shell, nucleus accumbens shell) and cell counts (the frontal cortex was also sampled at a more rostral level, and the striatum at more caudal level; not shown for simplicity). C, TH immunohistochemistry: relative optical densities in the medial and lateral dorsal striatum and in the core and shell of nucleus accumbens, in the three animal groups. *p < 0.05 for sham versus lesioned, #p < 0.05 for nonhyperlocomotor versus any other group, Tukey post hoc within striatal region after p < 0.001 interaction in a two-way ANOVA. D, TH immunohistochemistry: relative optical densities in the motor, cingulate, prelimbic, and infralimbic frontal cortex, in the three animal groups. Measures of the area occupied by immunoreactive structures provided similar results (data not shown). E, Counts of TH+ cells in the striatum. The high intensity of TH staining in the control striatum precluded individualization of cell bodies. Scale bar, 10 μm. F, SERT immunohistochemistry: relative optical densities in the medial and lateral dorsal striatum and in the core and shell of nucleus accumbens, in the three animal groups. *p < 0.05 Tukey post hoc for sham versus any other group within the dorsal striatum, after p < 0.001 interaction in a two-way ANOVA. G, Ratio of SERT optical density to TH optical density. *p < 0.05 Tukey post hoc for any comparison within the medial striatum, after p < 0.001 interaction in a two-way ANOVA. Data are mean ± SD.
