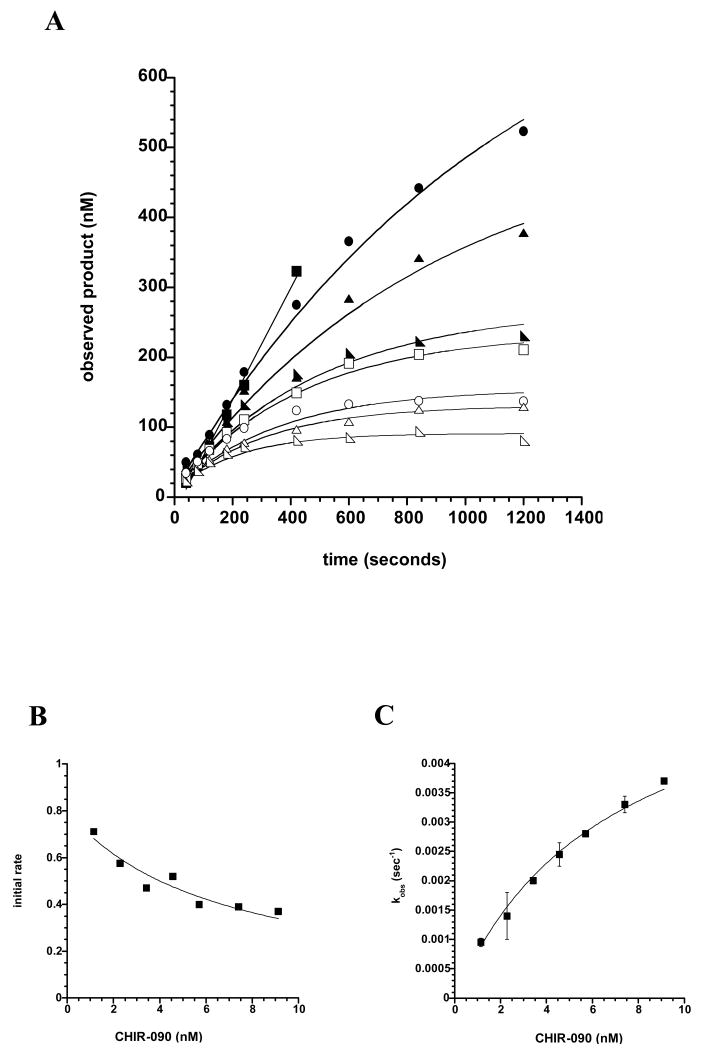
Figure 4. Progress curves for AaLpxC in the presence of increasing concentrations of CHIR-090.
Panel A) Time-dependent LpxC inhibition by CHIR-090. Wild-type AaLpxC (0.7 nM), which had not been preincubated with inhibitor, was used to start the assay in the presence of 0 (solid squares), 0.57 (solid circles), 1.14 (solid triangles), 1.7 (solid half-squares), 2.28 (open squares), 2.85 (open circles), 3.7 (open triangles), or 4.55 (open half-squares) nM CHIR-090. Panel B) Initial velocity as a function of CHIR-090 concentrations. Initial velocities were calculated from fitting the data obtained from the progress curves, shown in Panel A, to Equation 1 before the onset of time-dependent inhibition. These re-plotted data were fit to Equation 2 to determine the inhibition constant (Ki) for the initial binding of CHIR-090 to AaLpxC. Panel C) First order rate constant kobs as a function of CHIR-090 concentration. The kobs values were calculated from fitting the progress curves obtained in Panel A to Equation 1.

