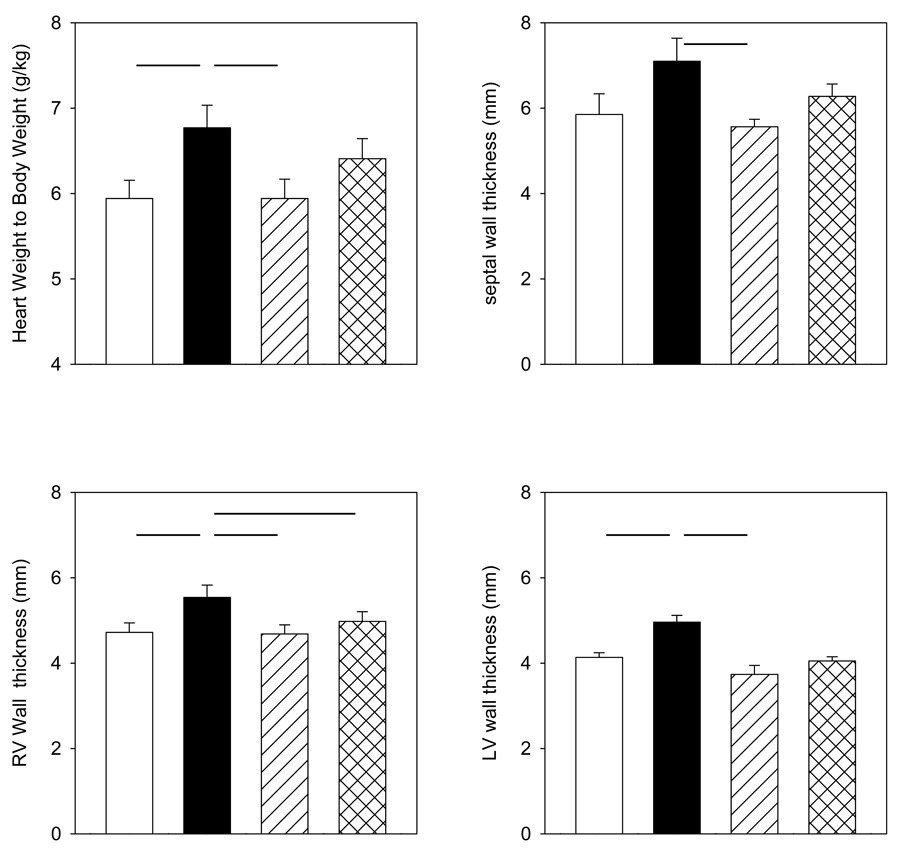
Figure 2.
Mean fetal heart measurements from control (open bars), cortisol (solid bars), cortisol+MRa (diagonal striped bars) or cortisol+GRa (cross-hatched bars) groups taken at time of sacrifice: heart to body mass ratio (upper left), left ventricular (LV) wall thickness (lower right), septal wall thickness (upper right), and right ventricular (RV) wall thickness (lower left). Data are expressed as mean ± SEM. Horizontal lines between groups indicate differences are statistically significant, p< 0.05.

