
Fig. 9.
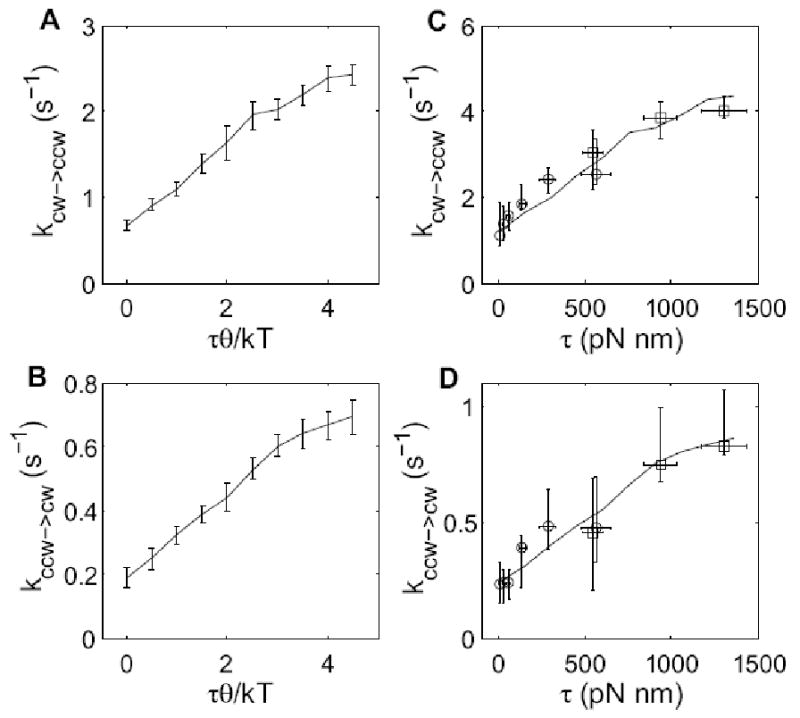
(A, B) Monte-Carlo simulations of the model of Duke et al.11. Each data point is the mean and standard deviation of 8 independent simulations, and each simulation is a 500 s long switching trace. (C, D) Fitting of the simulation to the measurements, with two free parameters in each fit: θ and a scaling factor in the vertical axis. Symbols with error bars are the measurements, and lines are the fitting of simulations.