
Figure 1.
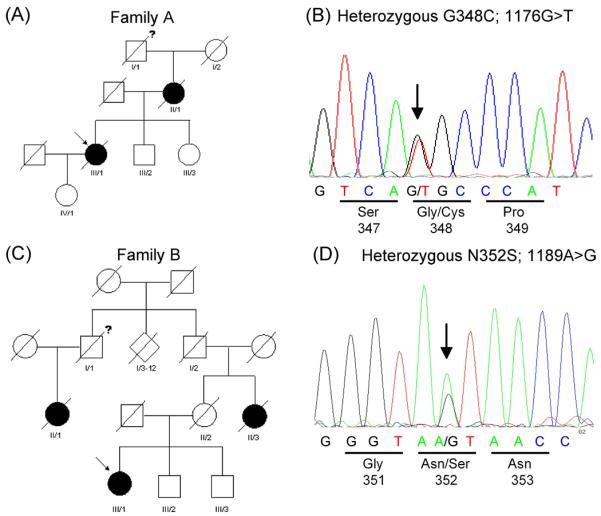
(A) Pedigree diagram of family A with the G348C mutation in TARDBP. (B) Chromatograms of part of exon 6 of the TARDBP gene showing G348C mutation in the index patient.
(C) Pedigree diagram of family B with the N352S mutation in TARDBP. (D) Chromatograms of part of exon 6 of the TARDBP gene showing N352S mutation in the index patient.
Filled symbols indicate affected individuals, “?” indicates possibly affected subjects. Arrow indicates index patients.