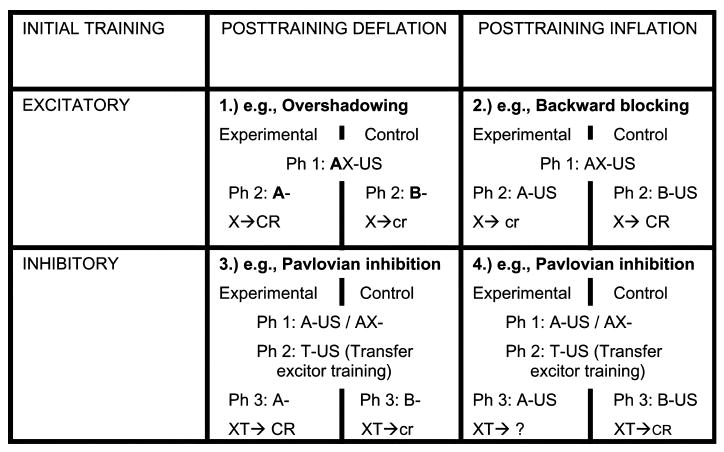
Fig. 2.

A 2 × 2 matrix of deflation and inflation effects upon both excitatory and inhibitory conditioning. ‘Ph’ followed by a number indicates a specific phase of training. ‘X’ represents the target stimulus, ‘A’ represents the companion stimulus, ‘US’ represents an unconditioned stimulus, and ‘-’ indicates that the stimulus was not followed by an unconditioned stimulus. ‘B’ represents the alternative stimulus that was presented to the control group. X or XT represents the test phase. ‘→’ indicates followed by. ‘CR’ and ‘cr’ indicate the expectation of robust and weak conditioned responding, respectively. Cell 1 (upper left cell) depicts an example of deflating the companion stimulus after conditioned excitation training. The boldface A indicates that A is of higher salience than X to encourage overshadowing. Cell 2 (upper right cell) depicts an example of inflating the companion stimulus after excitation training. To minimize overshadowing of X by A so there is the opportunity to see a decrease in responding to X, A is of relatively low salience. Cell 3 (lower left cell) shows an example of deflating the companion stimulus after conditioned inhibition training. Cell 4 (lower right cell) depicts an example of inflation of the companion stimulus after conditioned inhibition training. The effect anticipated in Cell 4 has yet to be demonstrated as denoted by the question mark.
