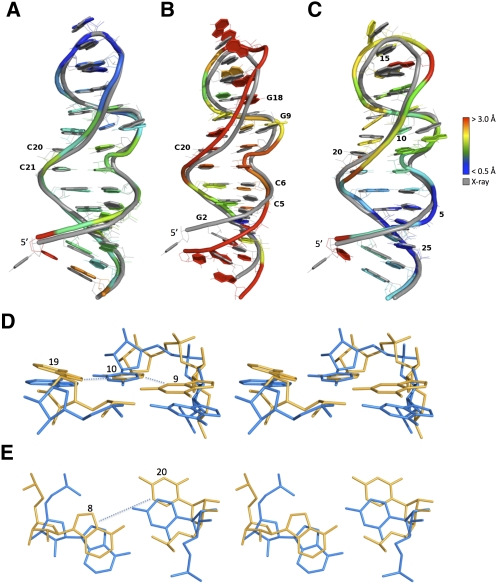
FIGURE 4.
Three models of the rat 28S rRNA loop E. The models are shown colored and the crystal structure in gray (PDB code 1Q9A). (Blue) Well modeled regions (RMSD < 0.5 Å), (red) badly modeled regions (RMSD > 3.0 Å). The models were optimally aligned (all atoms but H) with the crystal structure. (A) Model with a good INF (0.88; TP 29; FP 6; FN 2) and a good RMSD (1.64 Å); DI = 1.86. (B) Model with a good INF (0.88; TP 28; FP 5; FN 3), but a bad RMSD (3.76 Å); DI = 4.30. Although the geometry of the base pairs is well conserved, the thread through the phosphate atoms is shifted. (C) Model with a bad INF (0.71; TP 21; FP 7; FN 10), but a good RMSD (2.03 Å); DI = 2.85. The thread through the phosphate atoms is well superimposed, but the base-pairing geometry is wrong. Structural features that lead to a bad INF include: (D) base-stacking parameters that differ between the crystal (yellow) and model (blue) structures, such as G9, which shows a high rise in the crystal structure when compared with the model, and A19, for which a tilt can be observed between the crystal and model structures; and (E) base-pairing parameters that differ between the crystal and model structures, such as C20, which flips (propeller twist of 180°) between the crystal and model structures.

