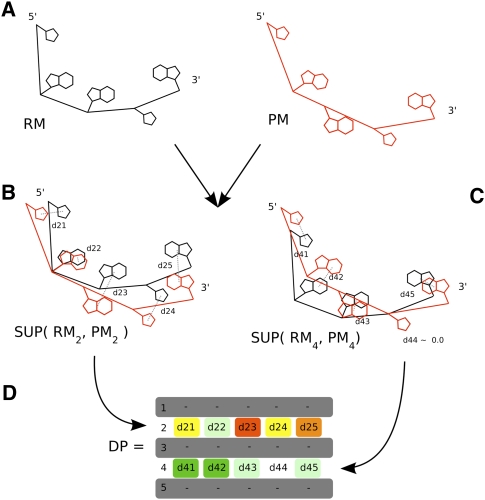
FIGURE 5.
Building steps of the deformation profile. (A) A predicted model (PM) will be compared with the reference model (RM). After superimposing PM over RM, minimizing the RMSD between nucleotides 2 (B) and 4 (C), the average distances between all atoms of corresponding nucleotides is calculated and recorded in DP matrix (D).

