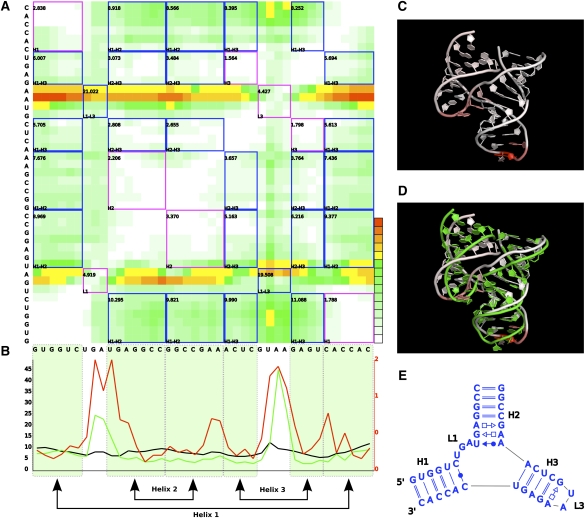
FIGURE 6.
Deformation Profile between predicted model 553 and the hammerhead ribozyme crystal structure. (A) DP matrix. Blue and pink squares inside the matrix correspond to intra- and interdomain similarity relationships, respectively. Numbers in the left top corner of each square are the average value of all positions inside the square. Color scale goes from 0 Å (white) to (but not including) 20 Å (dark green) in 10 equal steps and from 20 Å (yellow) to 80 Å (red) in five equal steps. (B) Average values of rows (green), columns (black), and main diagonal (red) of the matrix. (Shaded green regions) Helical strands. (C) 3D structure of the model. Each nucleotide is colored according to the respective row average value, from minimum (white) to maximum deformation (red) value. (D) Superimposition of the model and reference 3D structures. (E) Interaction network of the original molecule.

