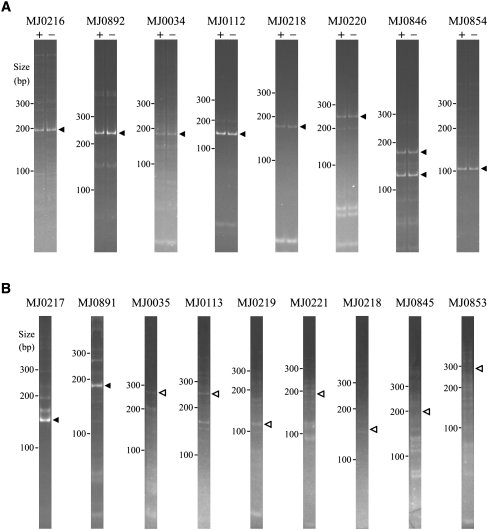
FIGURE 2.
Gel analyses of RACE products corresponding to RNA processing sites. (A) Products of 5′-RACE for RNA samples that have been treated (+ lanes) or not treated (− lanes) with TAP. RNA processing products produce bands in both lanes. Bands identified by sequencing as coming from the desired gene are marked by solid arrowheads. (B) Products of 3′-RACE reactions. Solid arrowheads indicate discrete 3′ termini coinciding with cleavage sites also seen by 5′-RACE. Open arrowheads indicate expected locations of RNAs produced by other processing sites.

