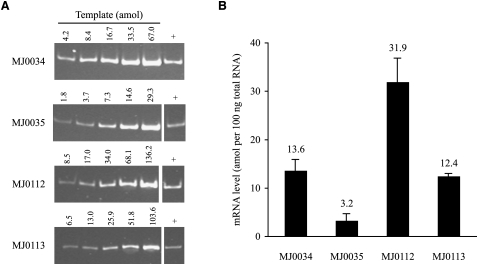
FIGURE 5.
Comparison of mRNA abundances upstream of and downstream from two processing sites by RT-PCR. (A) Ethidium bromide–stained polyacrylamide gels of the PCR products from DNA standards (left five lanes) and 100 ng of reverse transcribed cellular RNA (+). Amount of DNA in each standard is indicated above the lane. (B) Calculated amount of each RNA per 100 ng total cellular RNA (mean and SD of two experiments).

