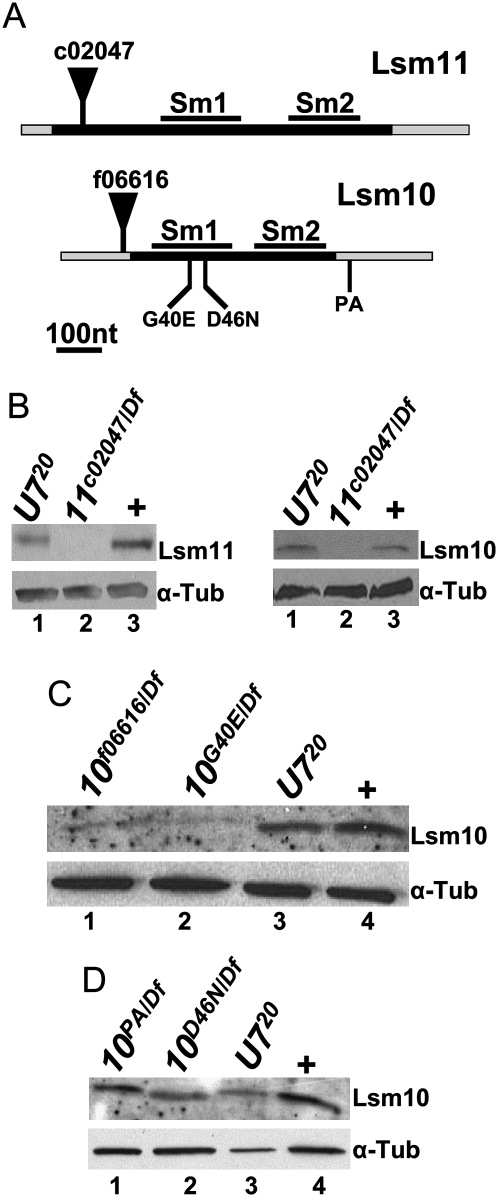
FIGURE 1.
Identification of Lsm10 and Lsm11 mutations. (A) Schematic diagram of the Lsm11 and Lsm10 genes. The black bars represent the coding sequence and the gray bars represent the 5′ and 3′ UTRs. Note there are no introns in these two genes. The position of the Sm1 and Sm2 domains are marked with black bars above the coding sequence. The positions of the pBac insertions are indicated by black triangles. The positions of the three Lsm10 EMS alleles are indicated below the gene. (B–D) Protein extracts of brain and salivary gland tissue from third instar larvae or adult flies (D) of the indicated genotypes were probed with anti-Lsm11 or anti Lsm10-antibodies by Western blotting. w1118 was used as a normal control here and in subsequent figures (+). α-Tubulin is used as a loading control.

