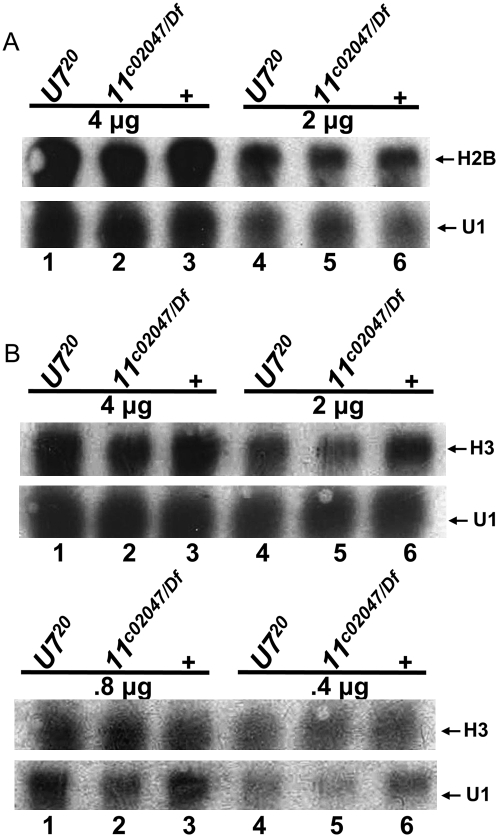
FIGURE 4.
Quantitative analysis of histone mRNA levels between U7 and Lsm11 mutants. (A,B) Total RNA was extracted from first instar larvae of the indicated genotypes and different quantities subjected to Northern analysis with a 32P-labeled probe to H2B (A) or H3 (B). U1 is used as a loading control.

