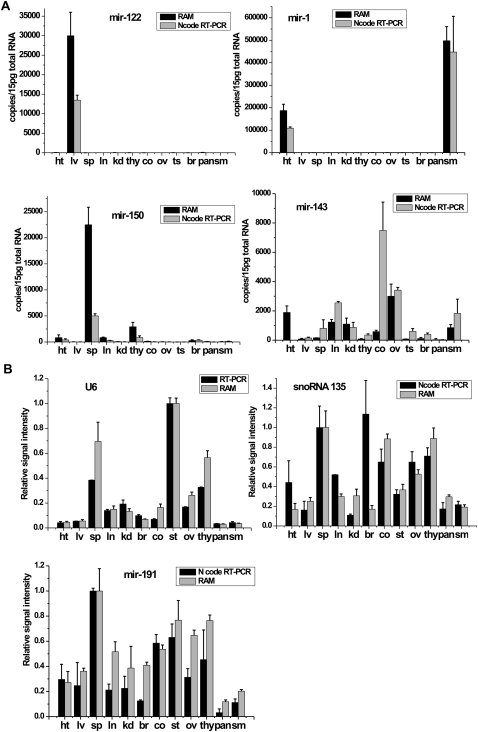
FIGURE 4.
(A) The expression profiles of miRNA-122, miRNA-1, miRNA-150, and miRNA-143 per cell were examined by the RAM assay (black bars) and Ncode RT-PCR assay (gray bars) across 12 mouse tissues. We assumed average 15 pg of total RNA per cell. ht: heart, lv: liver, sp: spleen, ln: lung, kd: kidney, thy: thymus, co: colon, ov: ovary, ts: testicle, br: brain, pan: pancreas, sm: skeletal muscle. (B) The relative signal intensity of endogenous controls including U6 snRNA, snoRNA 135, or miRNA-191. The black bars represented the relative signal intensities of U6, snoRNA 135 or miRNA-191 detected by the RAM assay. The gray bars represented their intensities quantified by conventional real-time RT-PCR or Ncode RT-PCR assay. Expression amount of U6 in testicle, or snoRNA 135 and miRNA-191in spleen was normalized to 1.

