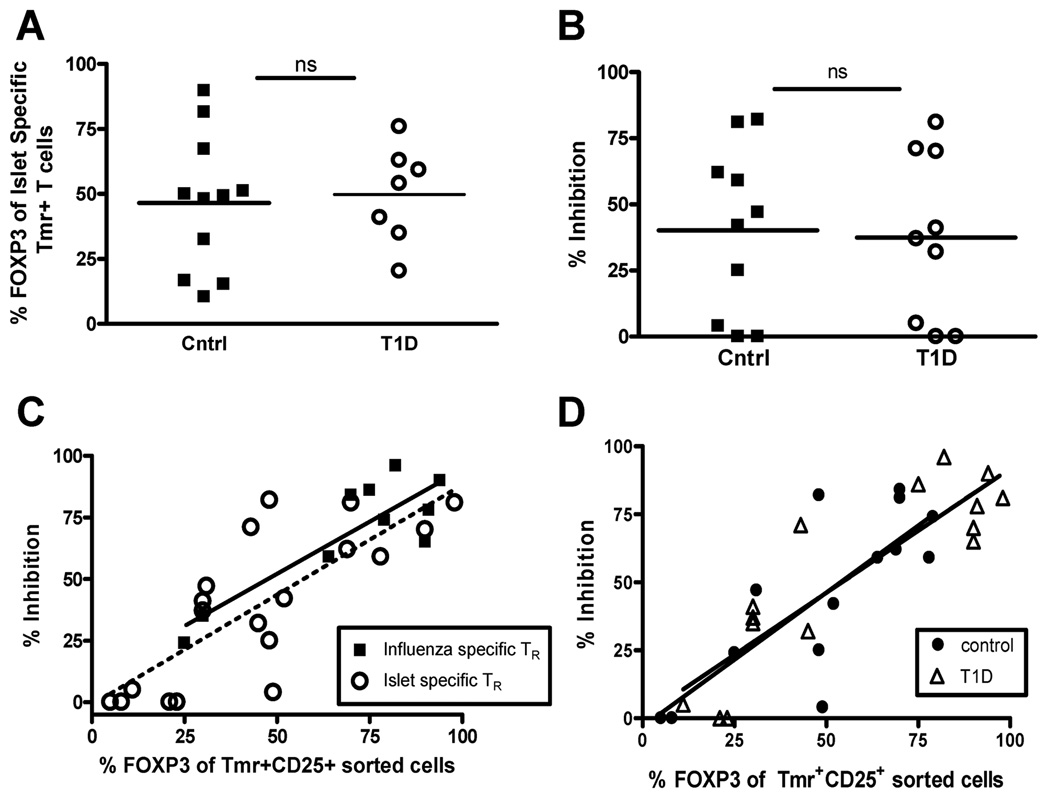
Figure 5. FOXP3 expression in antigen-specific adaptive Treg correlates with function in both control and T1D subjects.
(A) Peripheral blood CD4+CD25− T cells were isolated from control (▪, closed square) and T1D (○, open circle) subjects and activated with islet antigen-specific peptides. Fourteen days following activation, flow cytometry was performed to determine the percentage of Tmr+ T cells that express FOXP3. Statistical significance was analyzed using an independent students t-test. (B) Fourteen days following activation of CD4+CD25− T cells of controls subjects, CD4+CD25+Tmr+ cells were sorted and assayed for specificity and suppressive activity as performed in Figure 3A. Statistical significance was analyzed using an independent students t-test. (C) Potency of influenza- (▪, closed squares) and islet-specific (○, open circles) Treg was assessed using a nested linear model. Antigen specificity did not significantly influence the relationship between percent FOXP3 and percent inhibition. (D) Potency of antigen-specific adaptive Treg in controls (●, closed circles) versus T1D (Δ, open triangle) subjects was assessed by combining influenza and islet antigen-specific responses for each study population. Disease status did not significantly influence the relationship between percent FOXP3 and percent inhibition.

