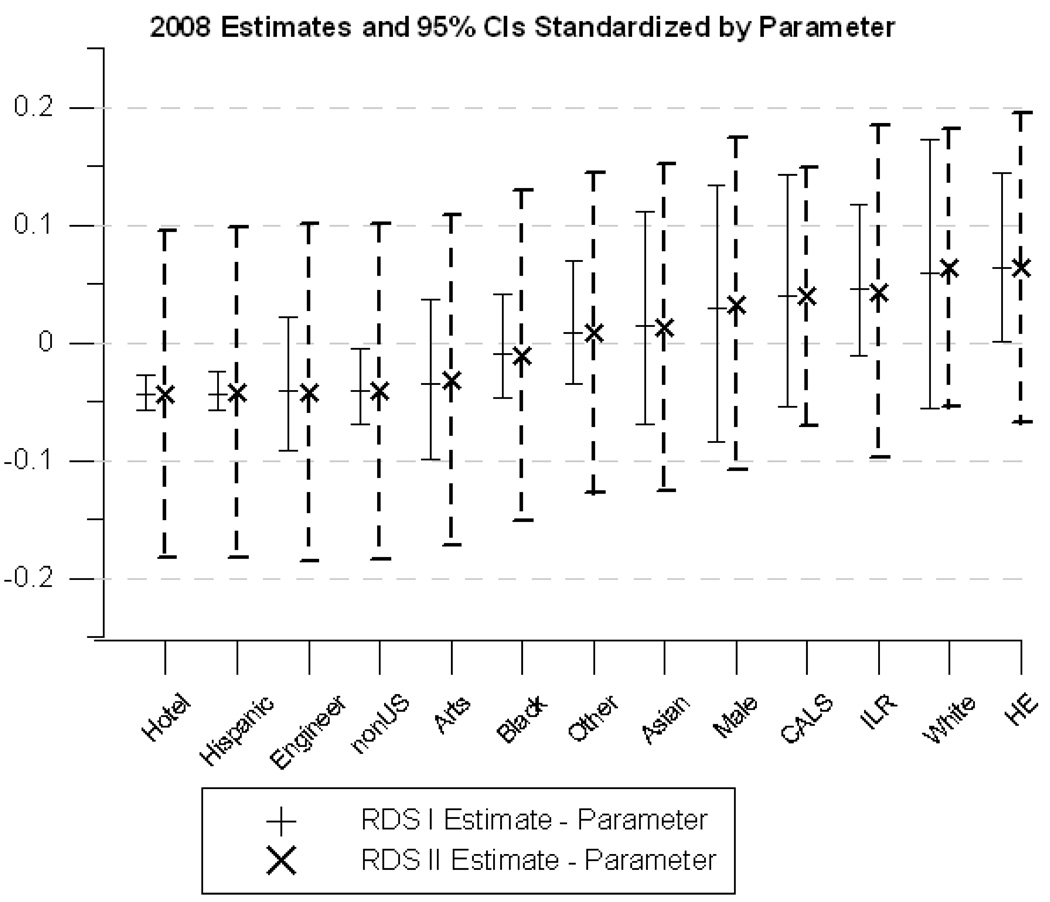
Figure 3.
RDS I (+) and RDS II (x) estimates and 95% confidence intervals for 13 dichotomous variables corresponding to race, gender, and college within the university calculated using the standard degree measure from the 2008 sample. The estimates are adjusted such that the line y = 0 represents the population parameter for each variable. Each estimate’s distance from the axis represents its distance from the true parameter. 95% confidence intervals for RDS I estimates are represented as solid lines while 95% confidence intervals for RDS II estimates are represented as dashed lines.

