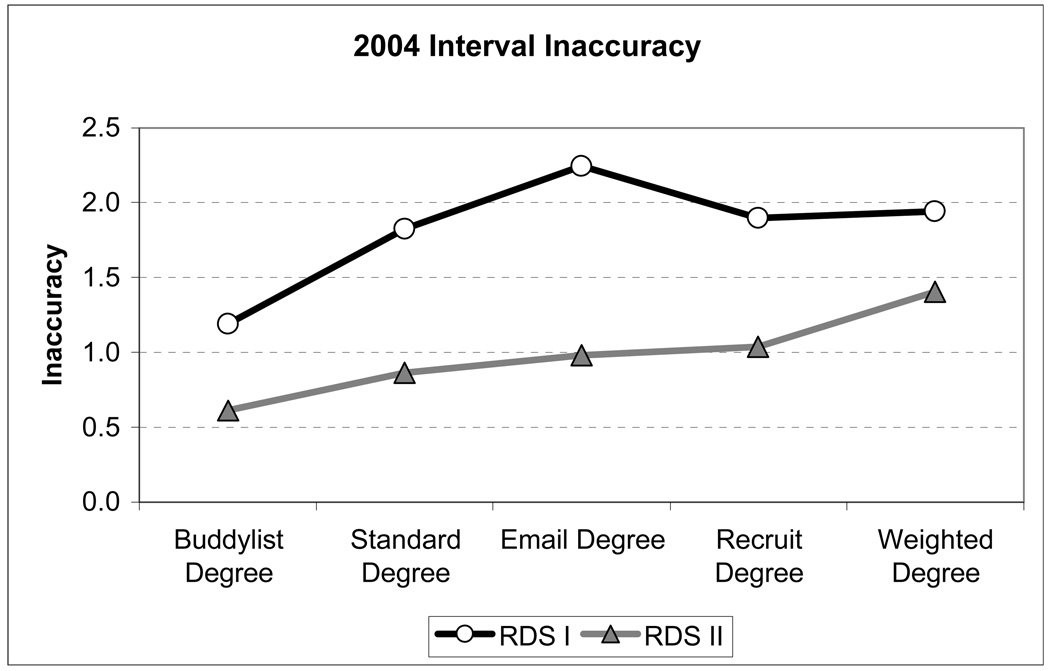
Figure 5.
Interval inaccuracy for RDS I (hollow) and RDS II (solid) estimates averaged across race, gender, and college for five measures of degree in the 2004 sample. The line y = 1.96 represents 95% confidence interval bounds. Any interval with inaccuracy greater than 1.96 fails to capture the population parameter. Confidence intervals based on RDS II variance estimation are wider and more likely to capture population parameters on average than intervals based on RDS I variance estimation.

