
Figure 3.
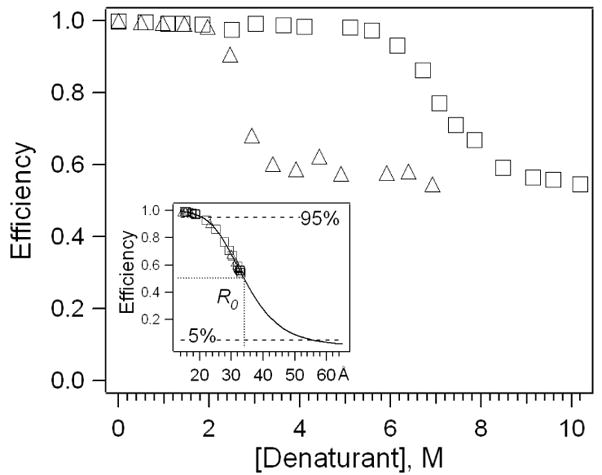
Trp-heme FRET efficiencies in cyt c as a function of gdmHCl (Δ) and urea (□) concentrations. Inset: FRET efficiency (solid curve) with R0 = 34Å. Experimental efficiencies in gdmHCl (Δ) and urea (□) are marked in the inset.
Official websites use .gov
A
.gov website belongs to an official
government organization in the United States.
Secure .gov websites use HTTPS
A lock (
) or https:// means you've safely
connected to the .gov website. Share sensitive
information only on official, secure websites.
Trp-heme FRET efficiencies in cyt c as a function of gdmHCl (Δ) and urea (□) concentrations. Inset: FRET efficiency (solid curve) with R0 = 34Å. Experimental efficiencies in gdmHCl (Δ) and urea (□) are marked in the inset.