
Figure 3.
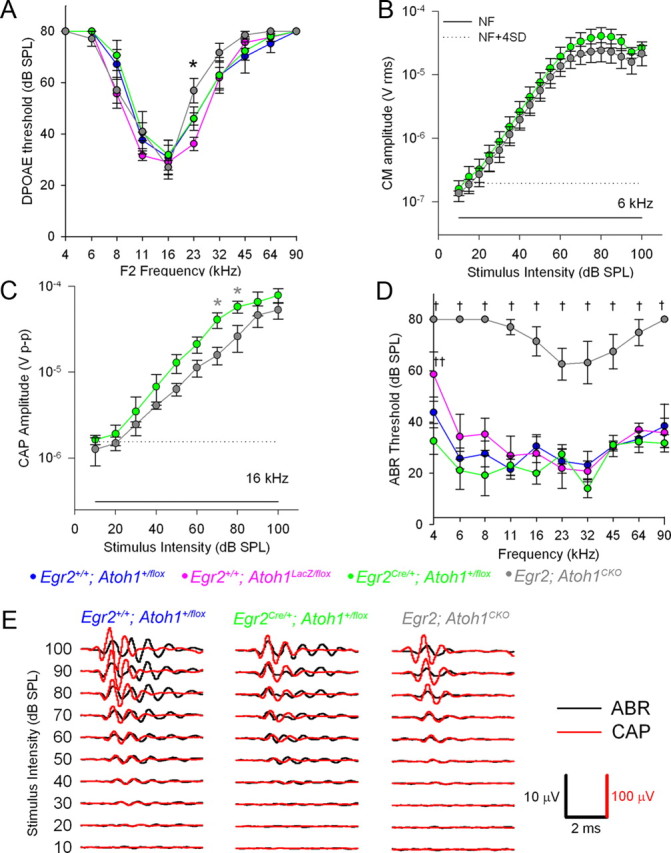
Egr2; Atoh1CKO mice have normal cochlear function but have mild auditory nerve and severe brainstem auditory pathway dysfunction. Data are plotted as mean ± SEM. A, DPOAE thresholds (n = 6–9 animals per genotype). There is only one statistically significant difference at 23 kHz (ANOVA followed by least-squares difference for pairwise comparisons, *p = 0.032 for Egr2; Atoh1CKO vs Egr2 +/+; Atoh1 +/flox and p = 0.0002 for Egr2; Atoh1CKO vs Egr2 +/+; Atoh1LacZ/flox). B, CM amplitudes from Egr2 Cre/+; Atoh1 +/flox (n = 4) and Egr2; Atoh1CKO (n = 3) animals. The solid line is the noise floor (NF), and the dotted line is the root mean square noise floor + 4 SD. There were no statistically significant differences between the responses of the two genotypes at any of the stimulus intensities tested. C, CAP amplitudes from Egr2 Cre/+; Atoh1 +flox (green circles; n = 4) and Egr2; Atoh1CKO (gray circles; n = 3) mice. t test, *p = 0.05. CAP amplitudes were mildly reduced in Egr2; Atoh1CKO mice relative to controls. Solid and dotted lines same as B. D, ABR thresholds (n = 7–9 animals per genotype). ANOVA followed by least-squares differences, † p ≤ 0.00000001 to 0.018 Egr2; Atoh1CKO vs others, †† p = 0.005 Egr2 Cre/+; Atoh1 +/flox vs Egr2 +/+; Atoh1LacZ/flox. ABR thresholds were significantly elevated in Egr2; Atoh1CKO mice relative to controls. E, Representative ABR and CAP waveforms from single mice. The CAP waveforms (shown in red) are similar among the animals, confirming that the auditory nerve is receiving information from the inner hair cell appropriately. However, the ABR waveform (shown in black) in the Egr2; Atoh1CKO animal is shorter in duration and has fewer peaks, suggesting that the signal is not propagated within the brainstem.