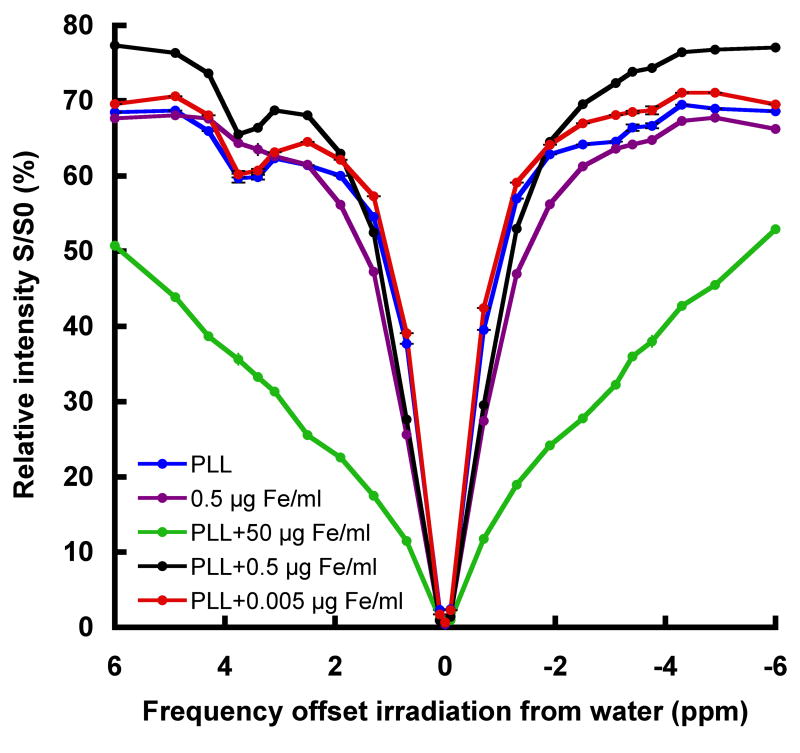
Figure 2. Saturation spectra.
mean relative signal intensities of the samples as a function of saturation frequency. The reduction in the signal intensity at Δω=3.76ppm from the water 1H frequency at 0 ppm is a specific CEST effect due to amide proton exchange in PLL. The increase in Fe concentration broadens the water line and explains the elimination of this CEST effect at higher iron concentrations.

