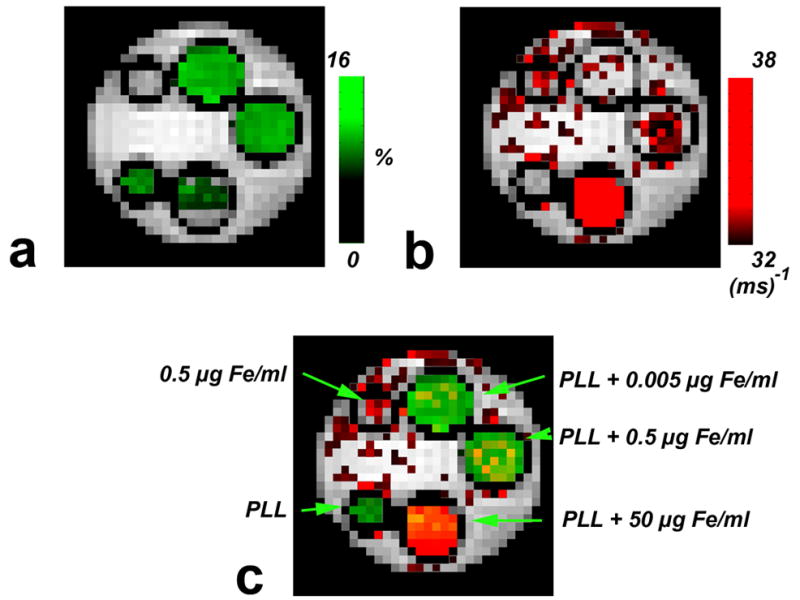
Figure 3. Concurrent dual MRI contrast.

a) CEST (MTRasym) map. b) R2 (1/T2) map of the same phantom. c) overlay of the maps a and b. The color-coded map shows that PLL and iron oxides can be distinguished from each other at lower concentrations, at higher concentrations the SPIO can “switch off” the CEST contrast.
