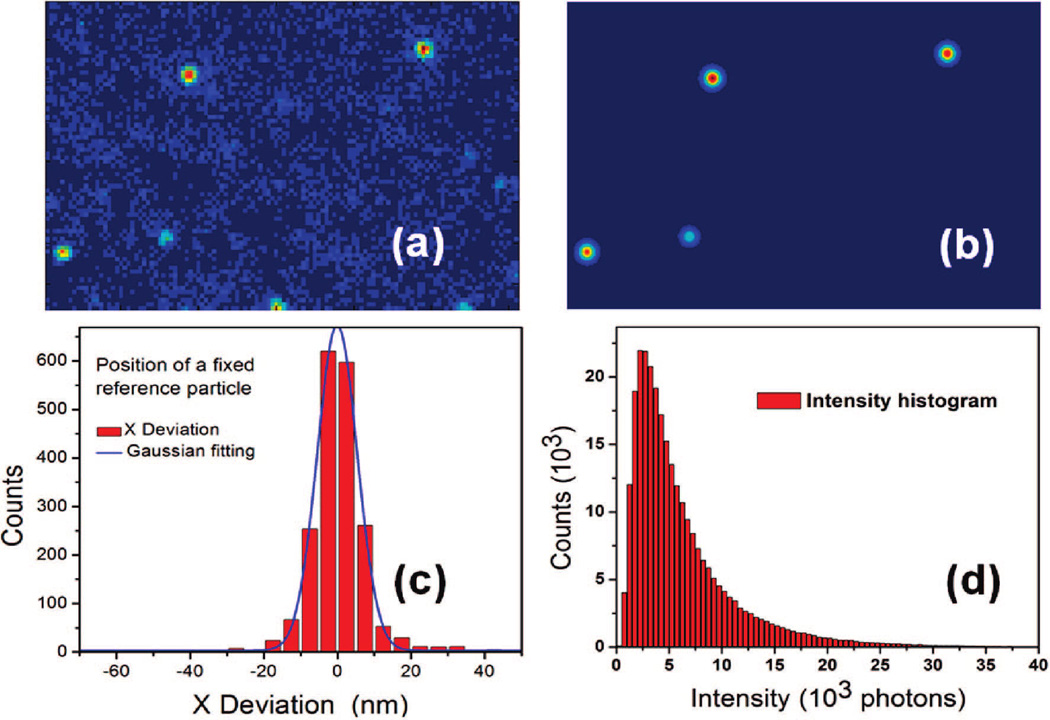
Figure 2.

(a) Single molecule fluorescent image captured by the CCD. (b) 2D Gaussian function fitting of the experimental data in (a). The center position and intensity of each single molecule was derived from the fitting. (c) Position distribution of subsequence measurements of a fixed reference particle on the substrate. The standard deviation indicates the resolution of our method, which is about 18 nm. (d) Histogram of single molecule signal from the sample in Figure 3. A threshold was set to cut those measurements with too low S/N ratios.
