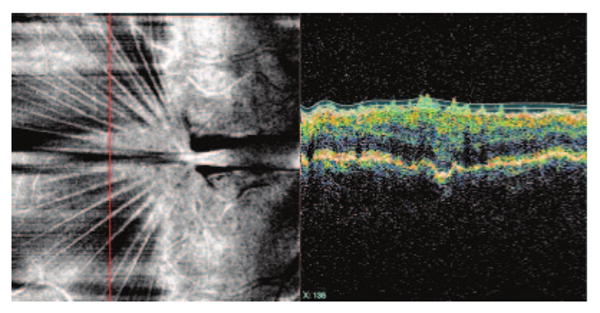
Figure 14.

Vitreoretinal traction secondary to an intraocular infection months earlier. Contour-modeling C-mode shows retinal folds at the ILM level centered at the point of greatest traction. Note that the cross-sectional OCT image (right) is sampled along the vertical line (left, red line) to visualize the retinal folds at the ILM level clearly.
