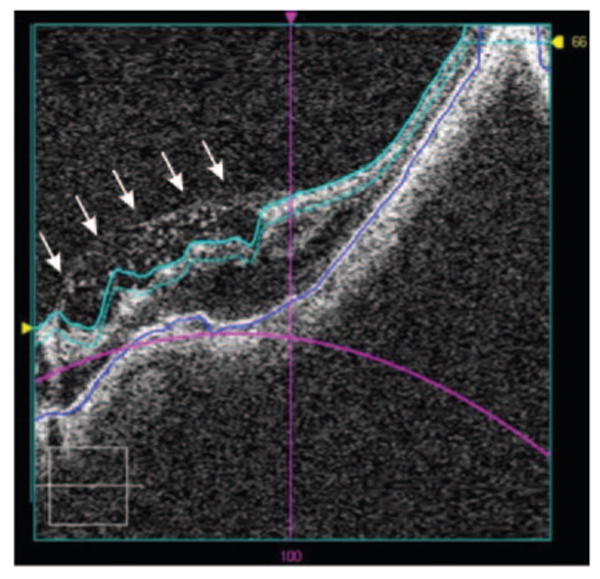
Figure 3.

Segmentation error sample. The segmented ILM border (top, light blue line) is not following the ILM properly at the cystic lesion (arrows) because of unusual retinal structure and poor signal quality. The smoothed fitted line (magenta) of the RPE also shows a tissue border definition that has no correlation with the detected RPE border (blue line).
