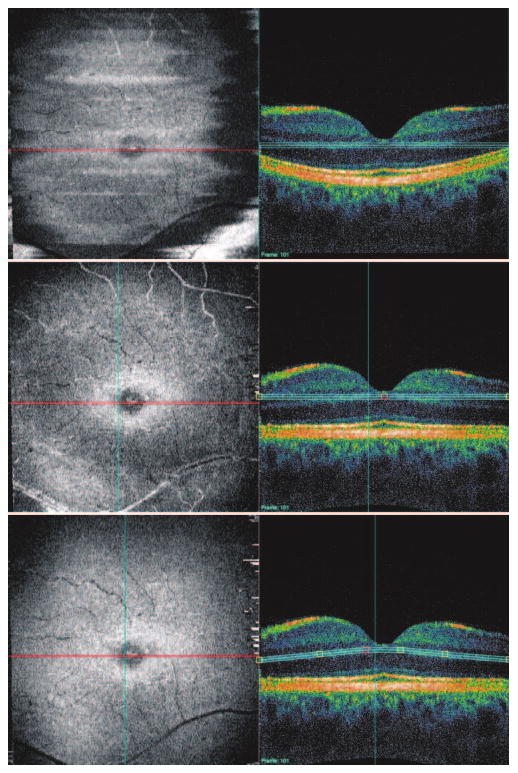
Figure 8.

RCN. Conventional C-mode (top) is marred by a mixture of multiple structures. Segmented C-mode (middle) shows the capillary network near the fovea, but other layers are visualized in the peripheral area. Contour-modeling C-mode (bottom) shows the most complete view of the RCN. This image was obtained with our prototype SD-OCT unit and was first flattened to the segmented RPE for both segmented and contour-modeling C-mode.
