
Figure 1.
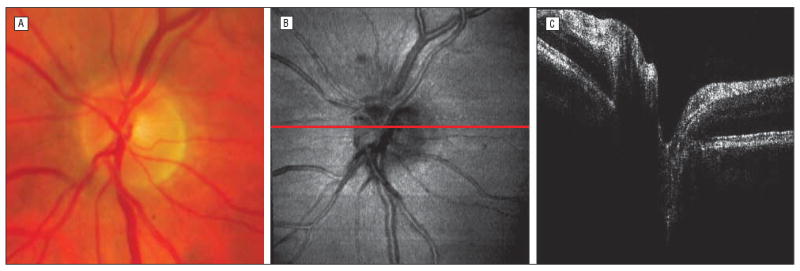
Three types of optic disc images from a single study participant. Although the color disc photograpy image (A) and the optical coherence tomography (OCT) fundus image (B) were not of the same size and orientation, vessel patterns and overall appearance were similar. The cross-sectional OCT image at the red line on the OCT fundus image in B is also shown in C.