
Figure 6.
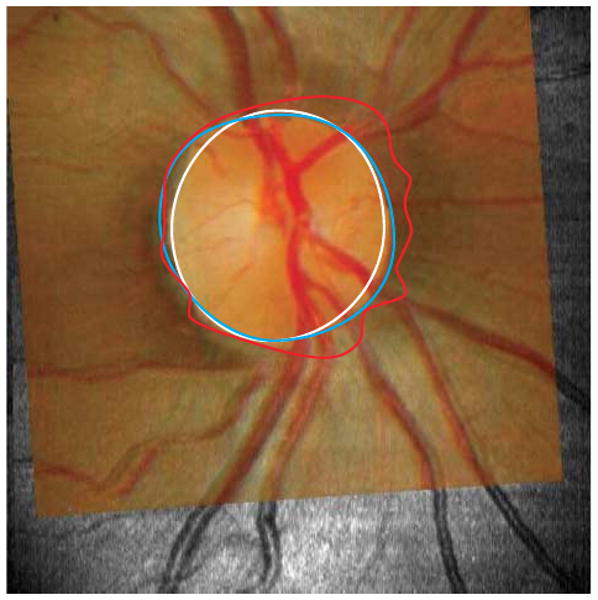
Typical optic disc margins drawn on 3 different types of images. Disc margins defined on disc photography (DP) image (blue outline), optical coherence tomography (OCT) fundus image (white outline), and cross-sectional OCT image (red outline) were shown on the corresponding DP image superimposed onto the matching OCT fundus image. The largest disc area was obtained when the margin was located using the cross-sectional OCT image retinal pigment epithelium termination technique. Location of the margin on the DP image yielded the second largest disc areas, and disc margin location using the OCT en face fundus image yielded the smallest disc areas. The irregularity of the margin of the cross-sectional OCT image was likely due to peripapillary atrophy and vessel shadows.